Community
Enterprise
Odoo.sh
CRM Dashboard
Detailed Dashboard View for CRM.
Detailed Dashboard View for CRM.


 Dedicated
Views
for Users and Admins.
Activity
monitoring.
Year to
Date
bar graphTarget Field in User Settings.
Top deals
and
Monthly revenue goals.
The users
will
have different authorization based on
the employment level.
Insight on
Upcoming and Recent activities.
Opportunity
Lost reason management.
Clickable
Dashboard Cards.
Dedicated
Views
for Users and Admins.
Activity
monitoring.
Year to
Date
bar graphTarget Field in User Settings.
Top deals
and
Monthly revenue goals.
The users
will
have different authorization based on
the employment level.
Insight on
Upcoming and Recent activities.
Opportunity
Lost reason management.
Clickable
Dashboard Cards.

You can click on the respective Cards which will direct the users to the respective information and aspects of the CRM operations with Odoo. Moreover, these Clickable Cards will act as a navigation icon within the CRM dashboard for the easiness of operations. Furthermore, these Clickable Cards will ensure that the configuration and the operations of the CRM dashboard are the way you need them.
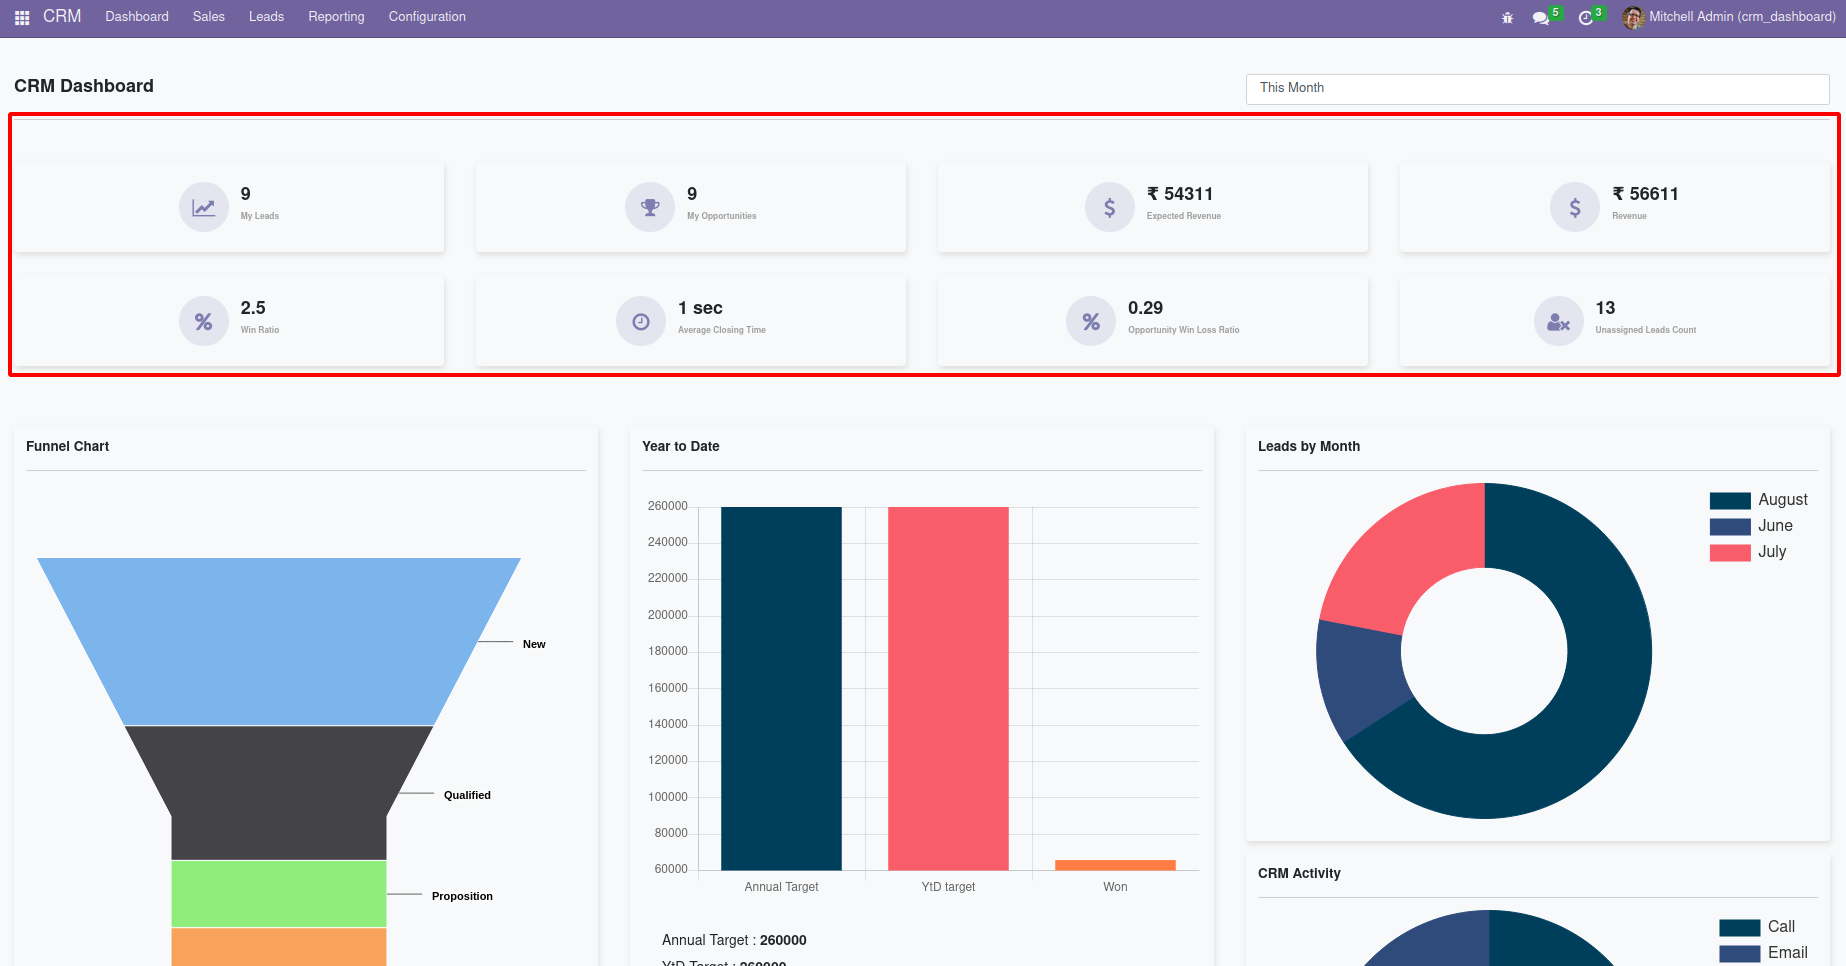
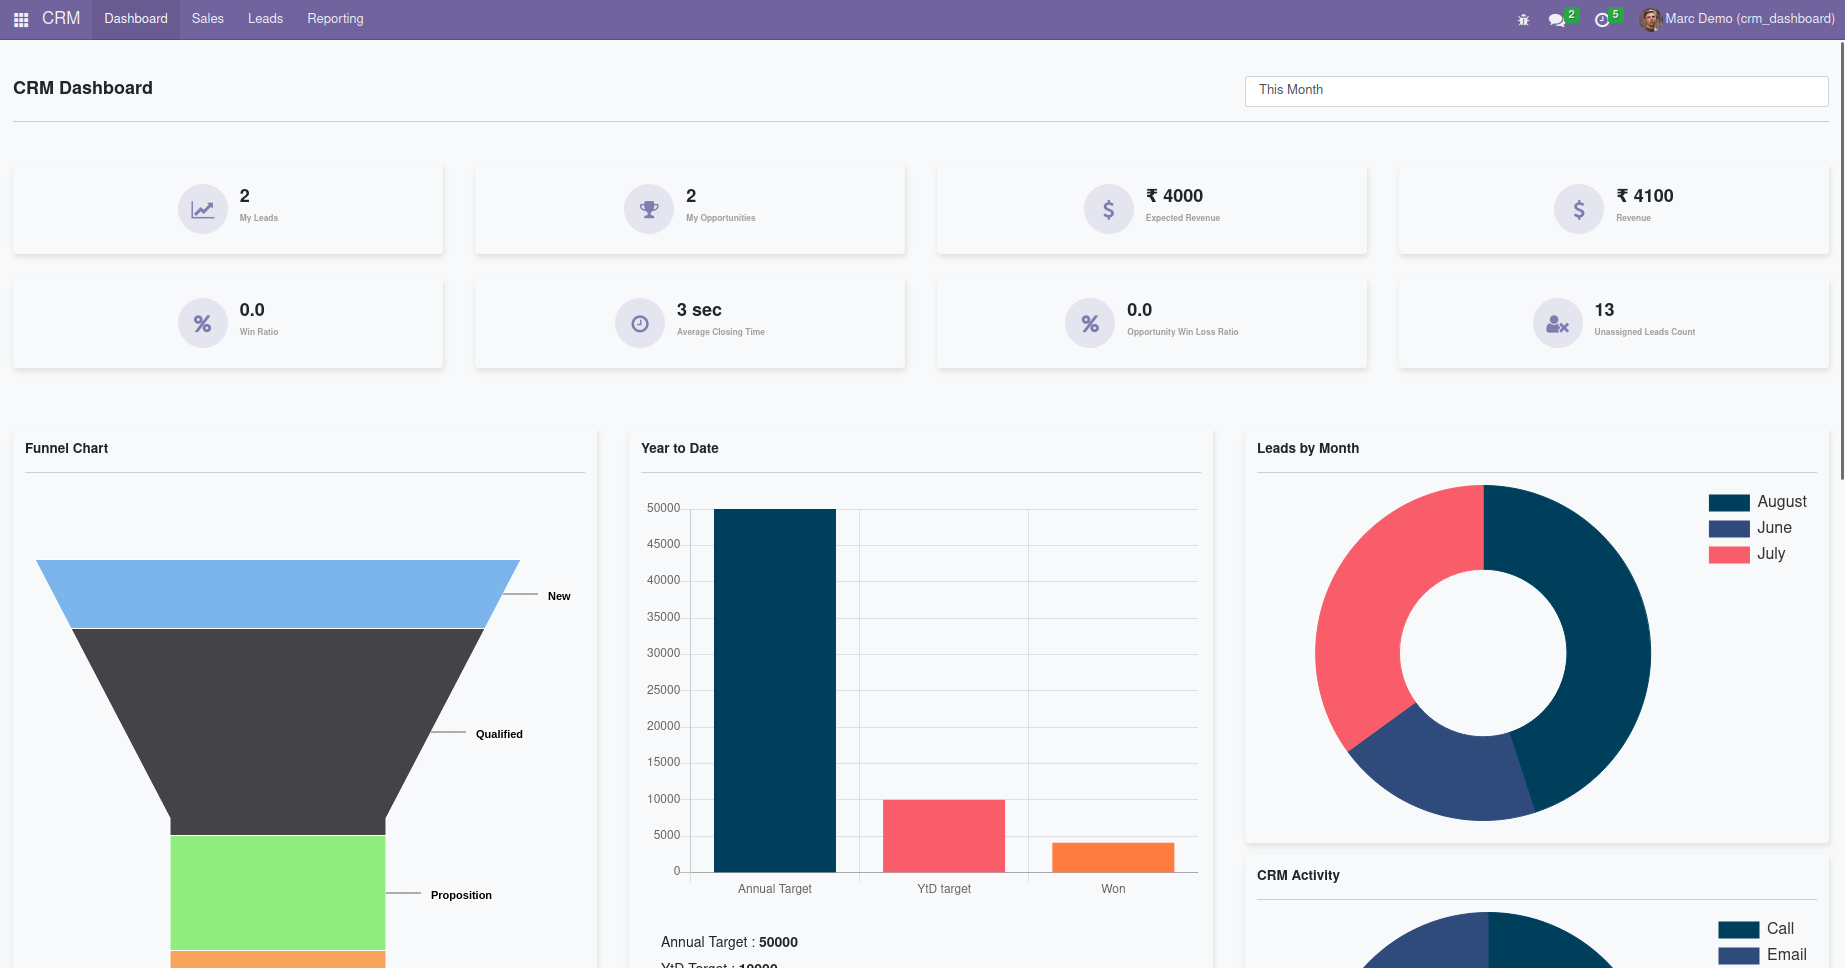
A dedicated Funnel Chart provides you with complete insight into the Leads which are in operation. The leads will be depicted as New, Qualified, Proposition, and Won. Moreover, the Year date target will provide an insight into the goals which are achieved. The Donut graph based on the monthly Lead operation will provide a clear picture of the monthly Lead operations. Additionally, the Activity Donut graph will describe the activity analysis on the leads.

With the CRM Dashboard configuration, you will be able to set the individual target amount for the Leads to be acquired by a user for a period of time, which can be set as Date, Month or Year. The Targets can be set under the Settings tab > User Settings > Below the access right tab.

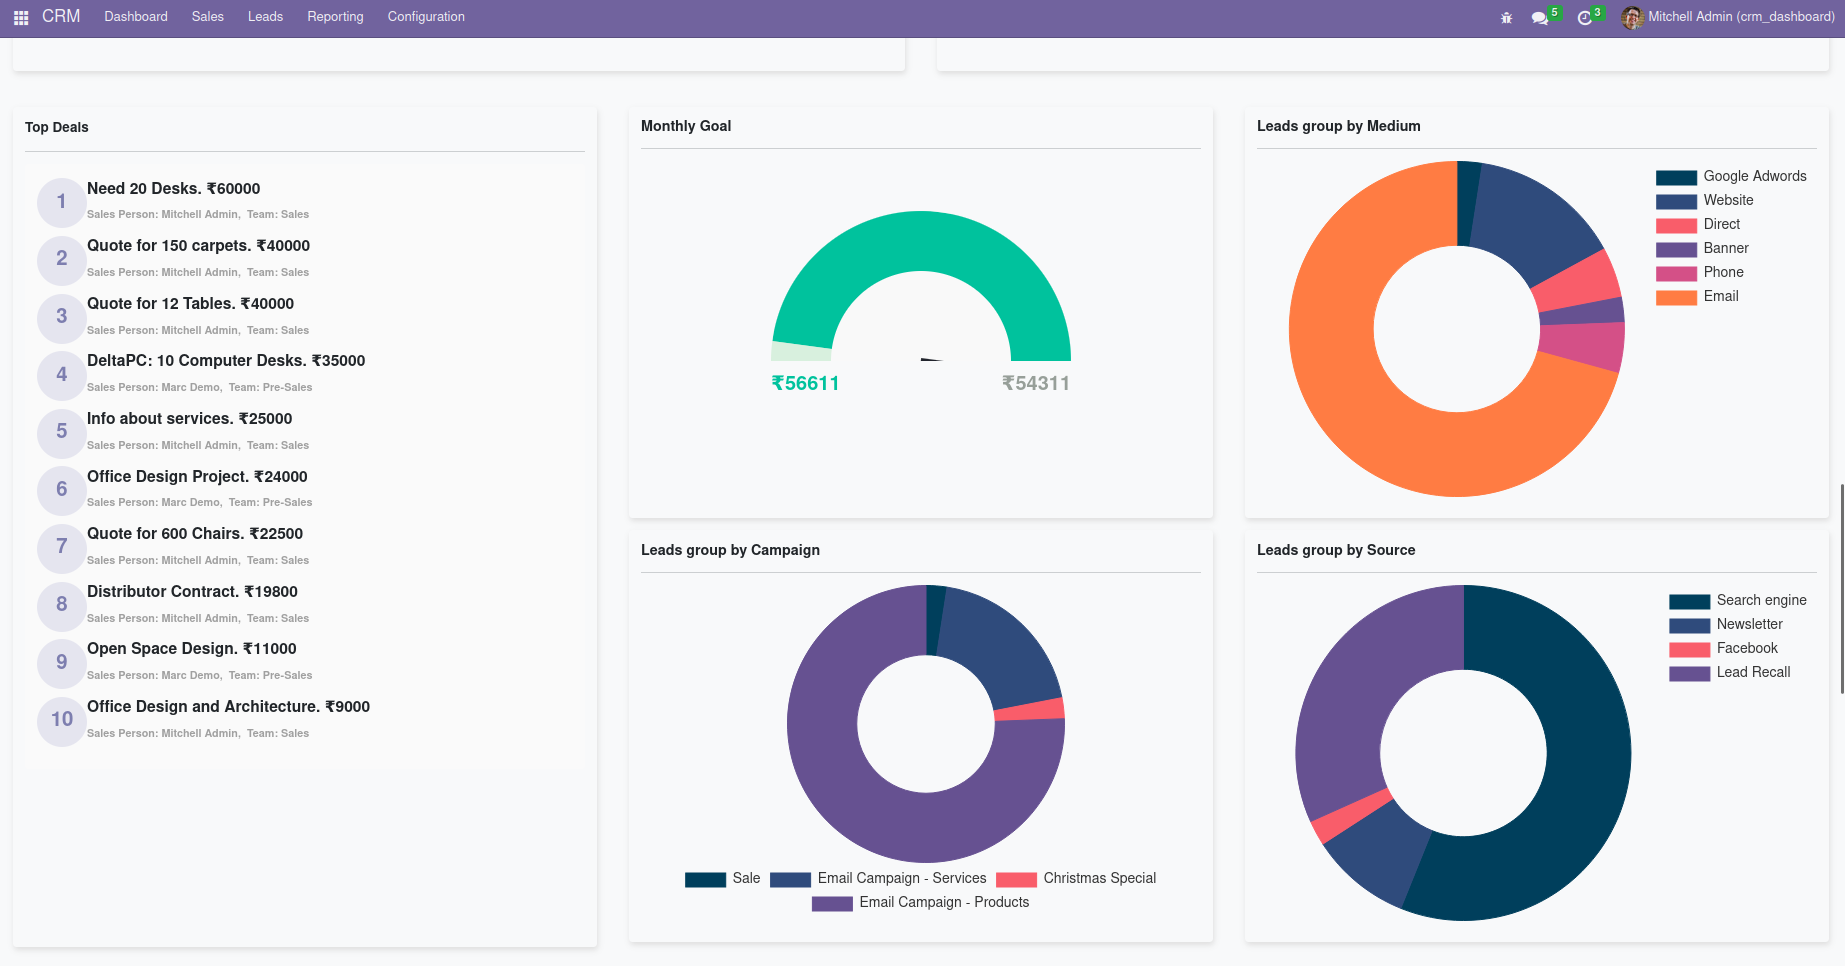
The Top Deals
on
the products and services will be listed out in a dedicated menu which helps
the users and the Salesperson to deal with the Leads and Opportunities with respect to it.
Moreover, this will be a useful tool in promoting the various deals instantly to the Leads
and the Opportunities.
The Monthly Goal Gauges that are available will serve as a motivation booster for the Sales
team as well as the users to pursue on more leads to achieve the target. Additionally,
the Lead Groping analysis with the help of the graph in the form of Donut providing analysis
on Lead Groups by Medium, Campaign, and Source will be helpful for the business.
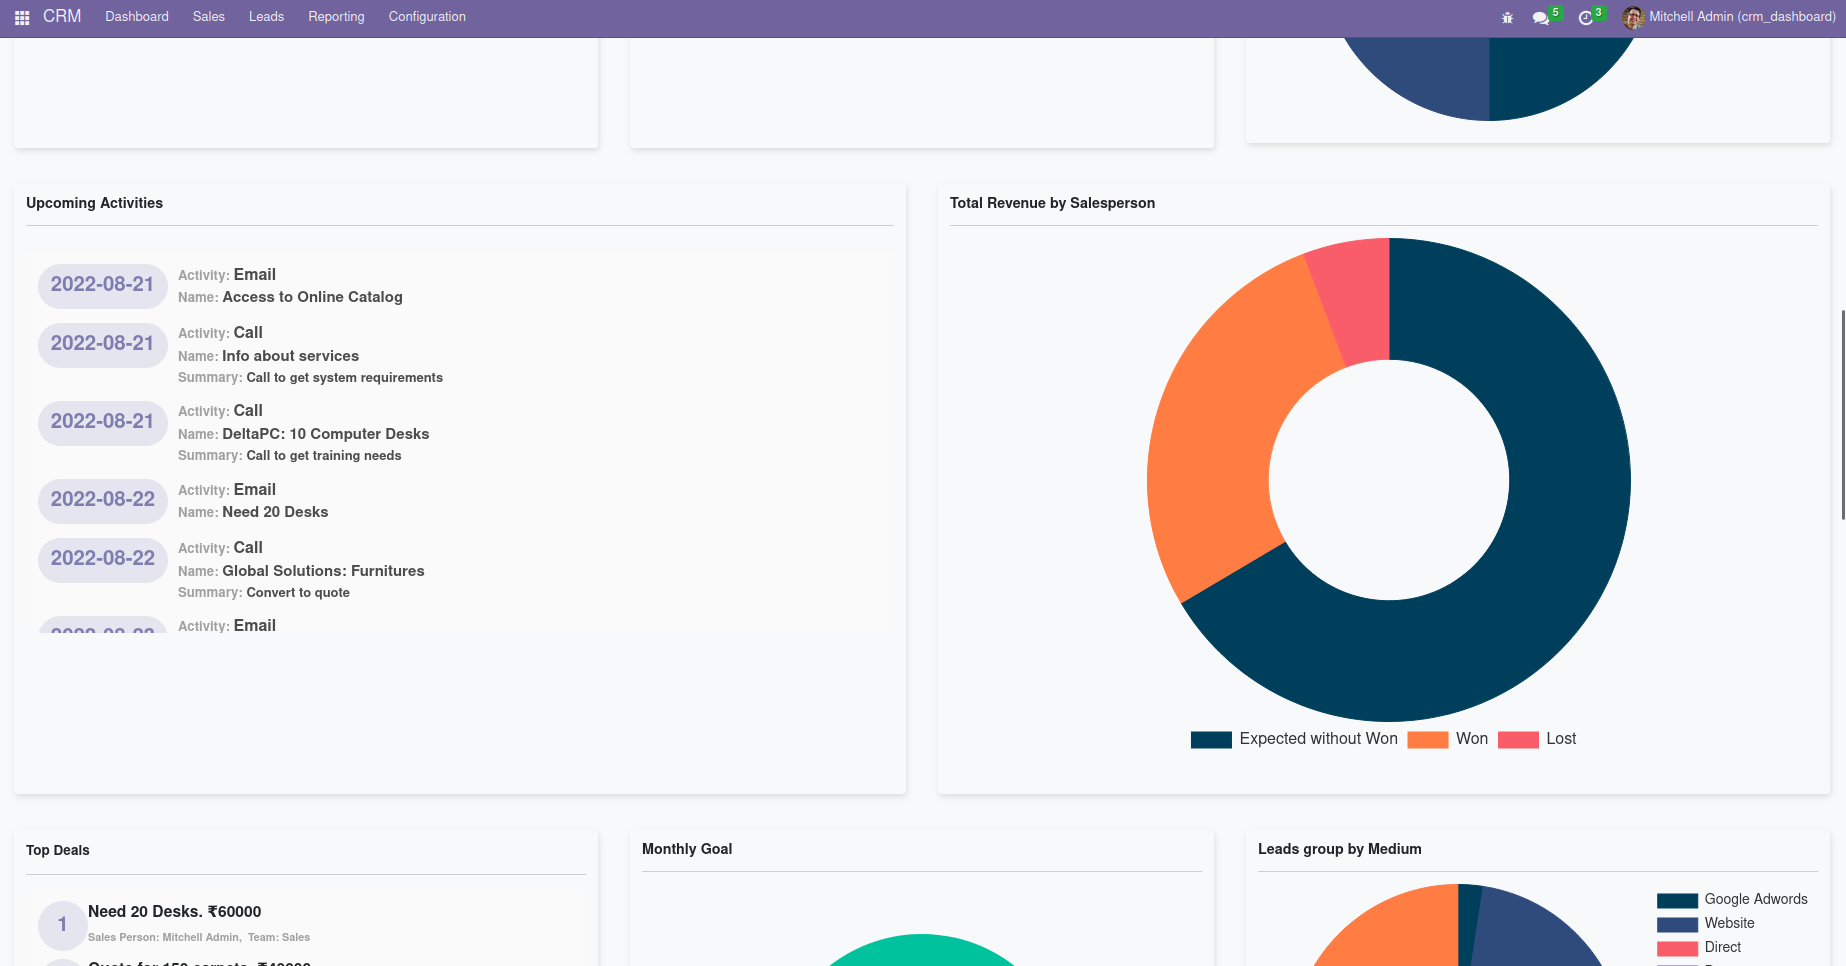
Activity
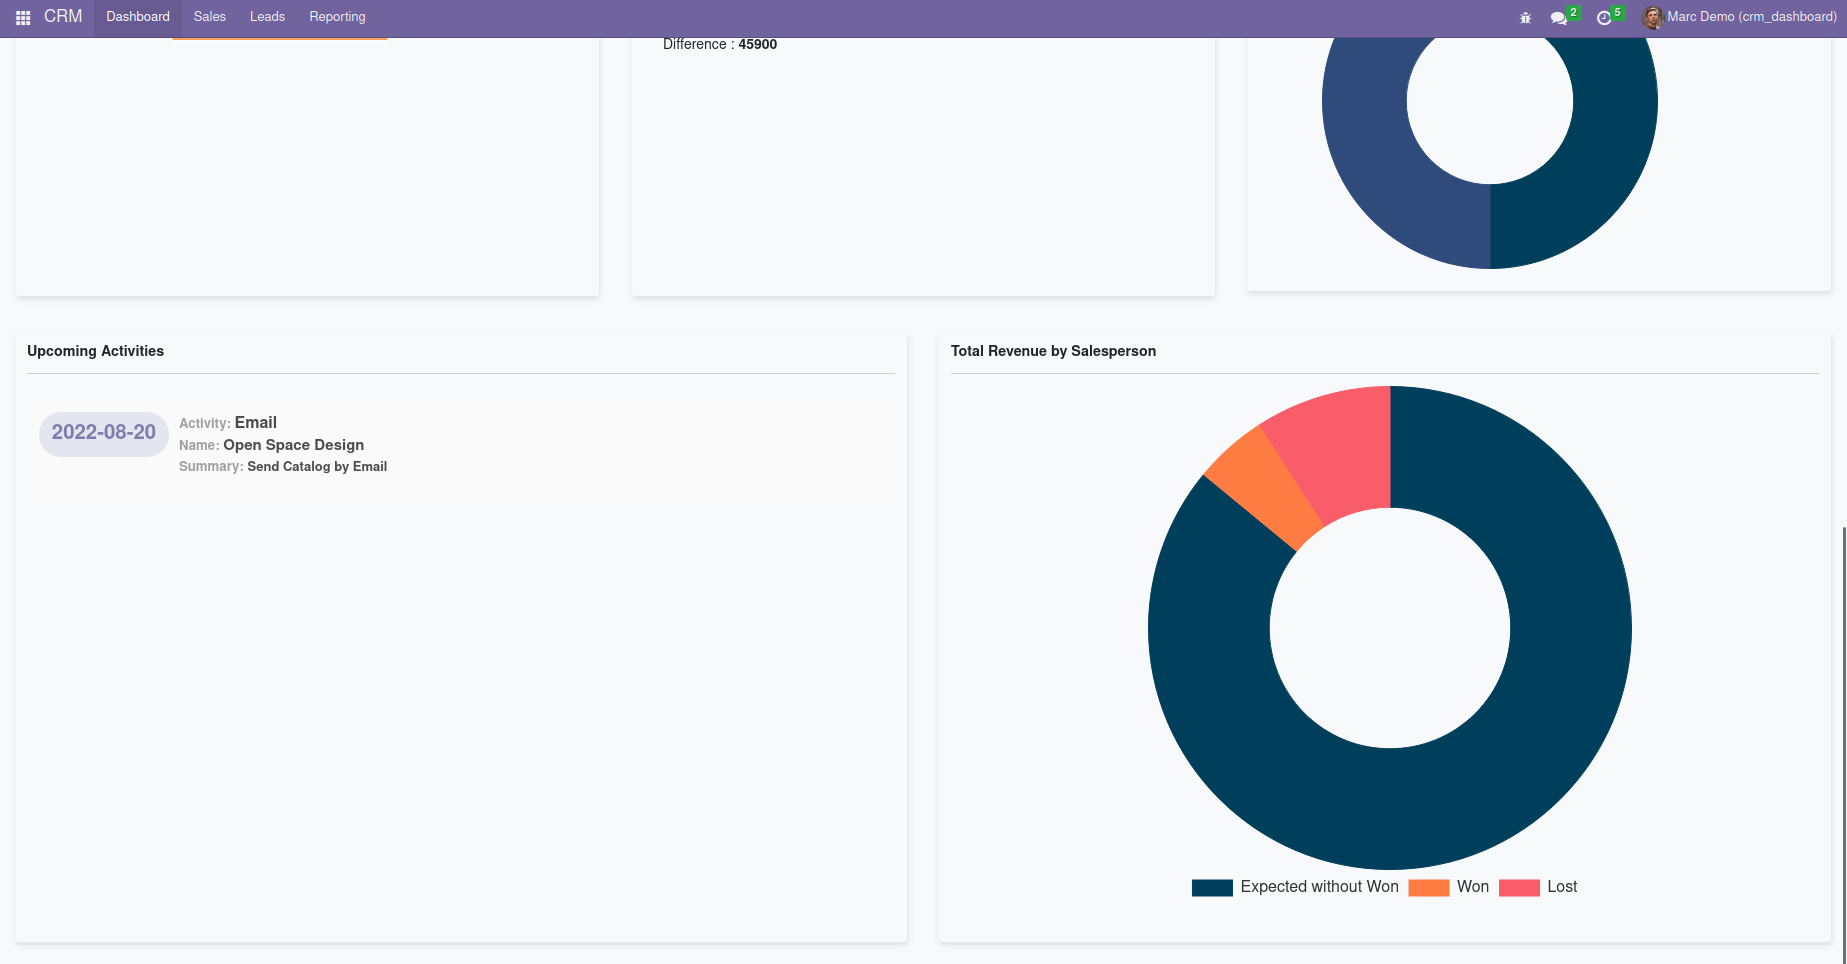
management is vital for CRM operations and the CRM Dashboard will provide a dedicated
tab defining the upcoming activities. These tabs will be different for each user based on their
operations in the company. Moreover, the Admin will have a separate view of their own activities
having clearer insight into the operations.
Furthermore, the Total Revenue of the respective Salesperson will be depicted in the form of
a graph providing the complete insight into the Revenue from the Leads which are being
generated.
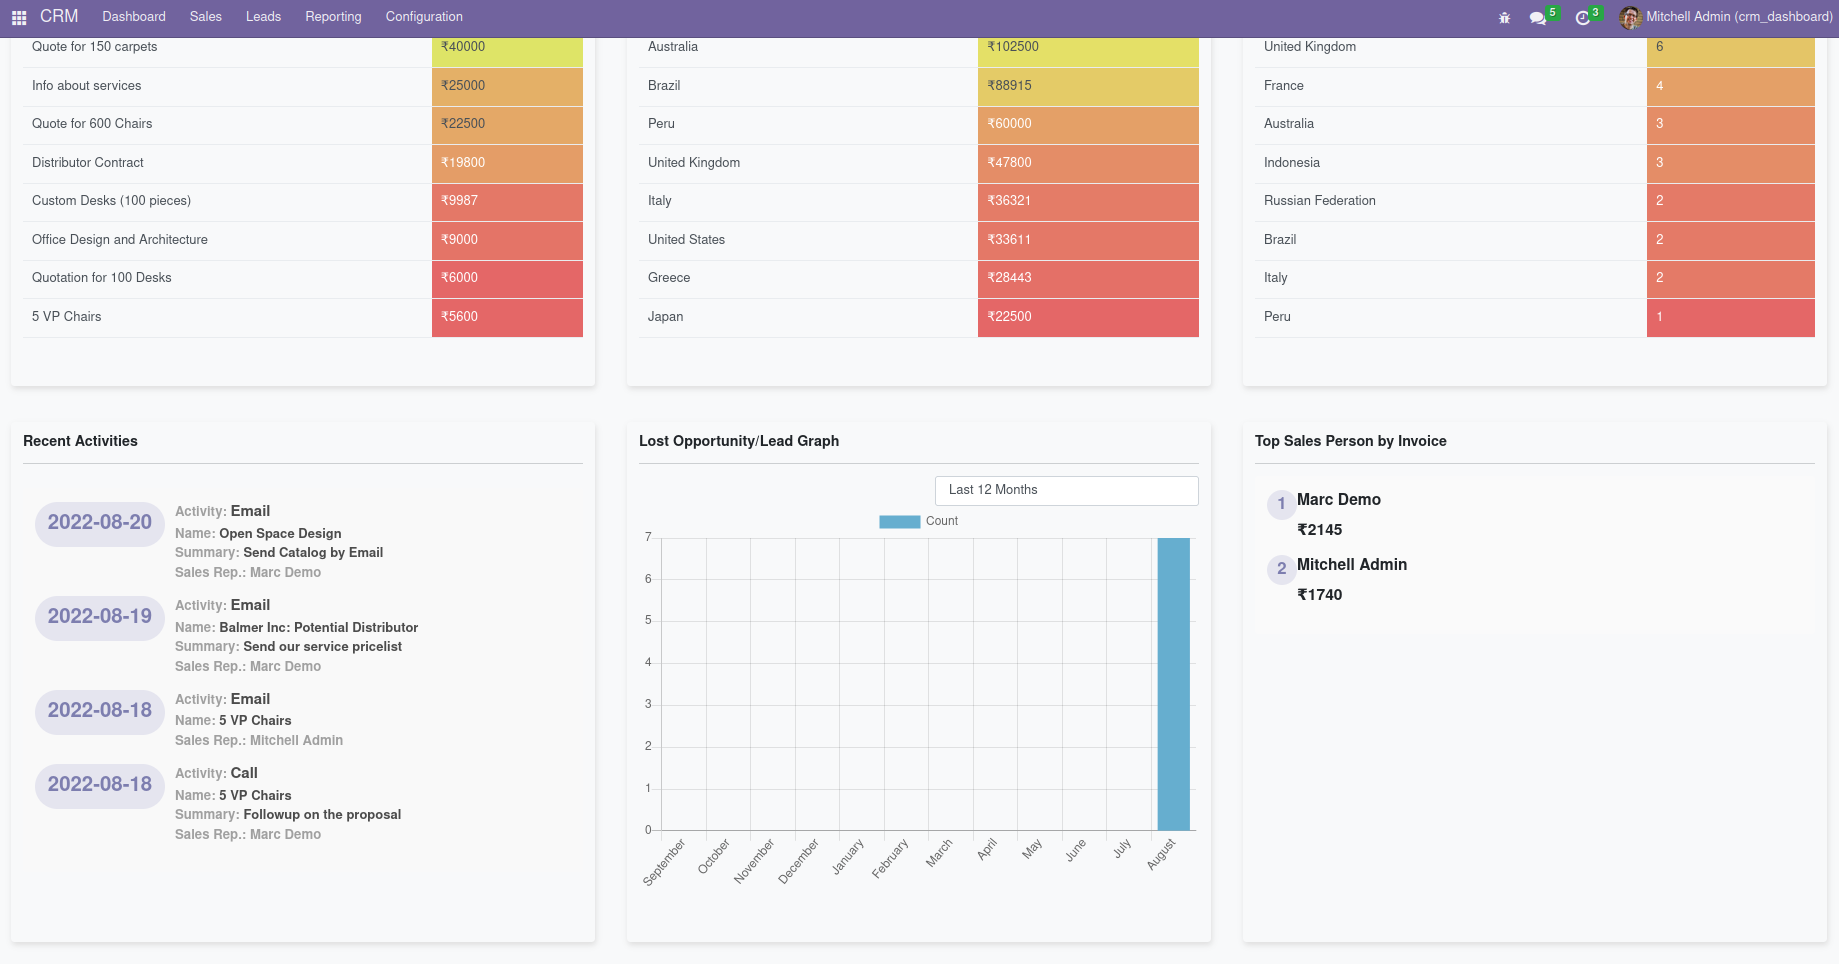
In the CRM Dashboard, you will obtain an informative heat map on the aspects of the Revenue obtained based on the CRM operations. Here the Top Salesperson, as well as Top Country Revenues, will be depicted with a color-coordinated Heat map providing clear insight on the financial values of revenue which is being generated. Moreover, a detailed tab will provide the information on the country-vise count on the opportunities which are being attained. The Country-wise count is also depicted on a heat map.
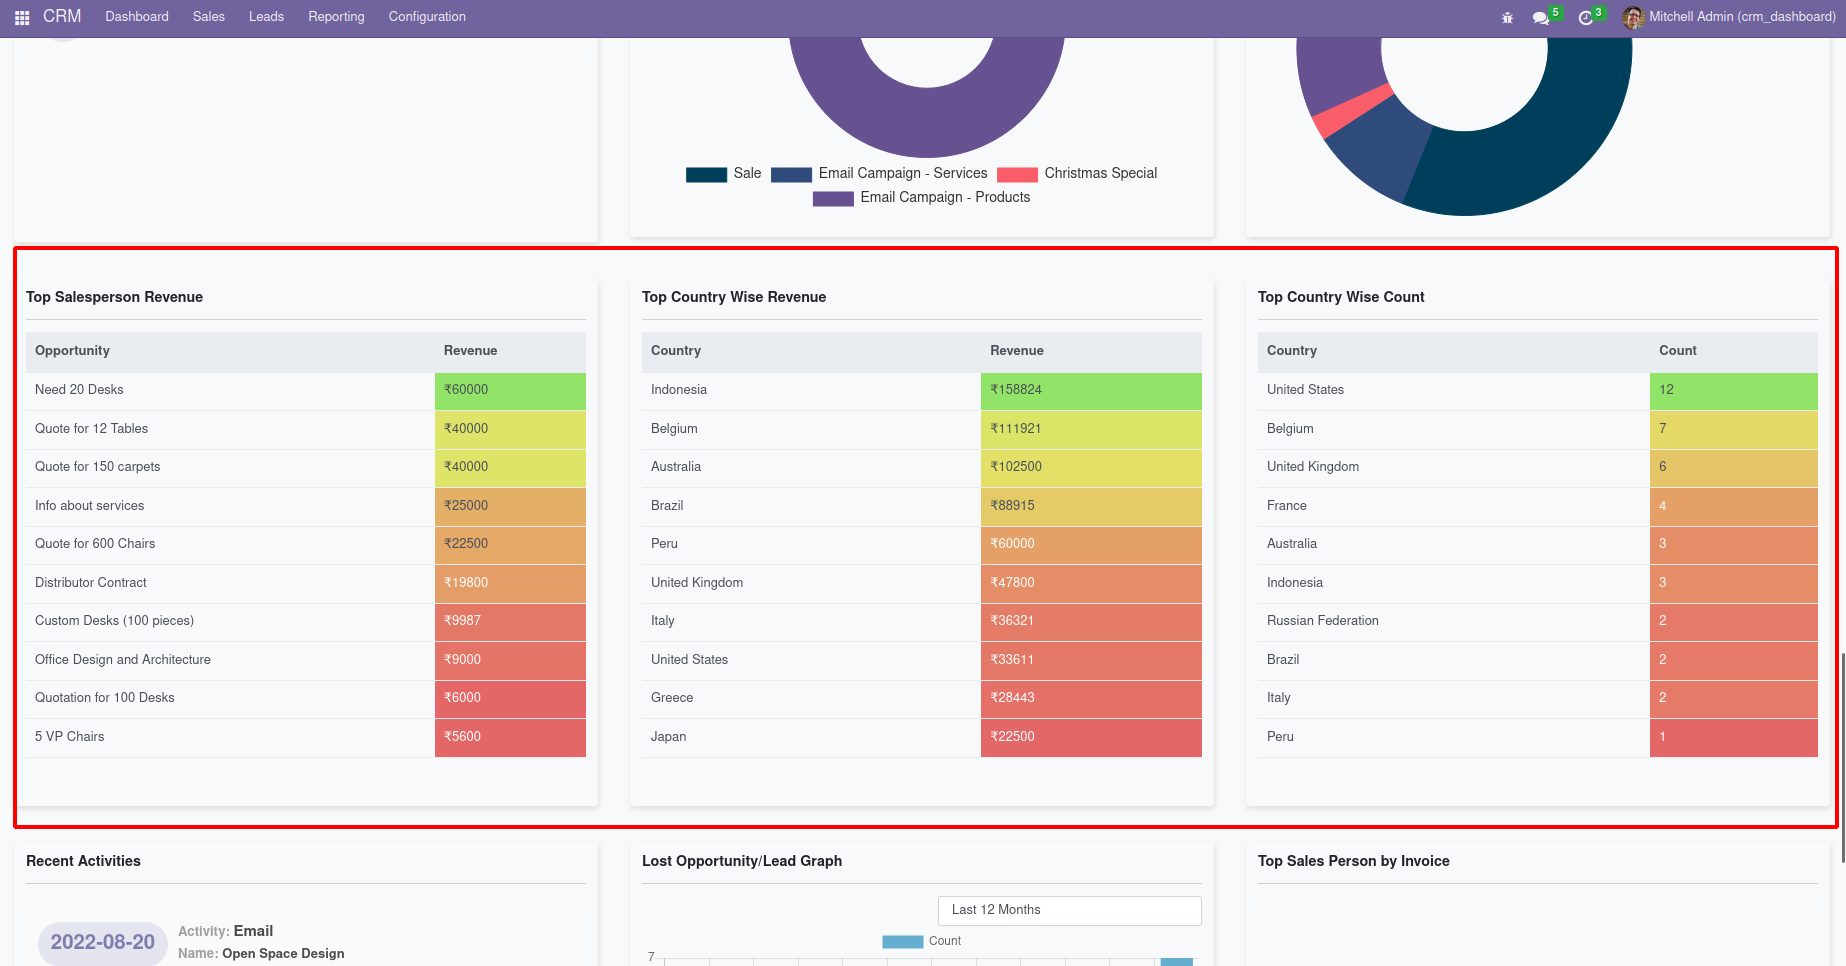
You will get an insight on the lost opportunities and Leads from the Lost Analysis Graph providing a clearer insight based on year or month. The Recent Activities description tab will provide a complete insight on the Activities which have been scheduled and conducted recently in regard to the Customer Relationship management operations on the pursuing of Leads and Opportunities.
As mentioned earlier there are dedicated views for the Admin as well as the User who has access to the CRM Dashboard. The Following screenshot depicts the User view of the CRM Dashboard. Here the information relating to the respective user and their operations will be only depicted and the ones which the respective User has authorization to can be modified.


Easily procure and sell your products
Easy configuration and convivial experience
A platform for educational management
Plan, track and schedule your operations
Mobile friendly, awe-inspiring product pages
Keep track of services and invoice
Run your bar or restaurant methodically
An all-inclusive hotel management application