Overview
Heat map can be used to color the entries in the pivot view. The coloring will be in a format where the maximum value will be shown in a dark color and next largest value will be in a lighter color than the maximum one. This applies for all the values in the table.
Features
Heat Map for Pivot View
Screenshots
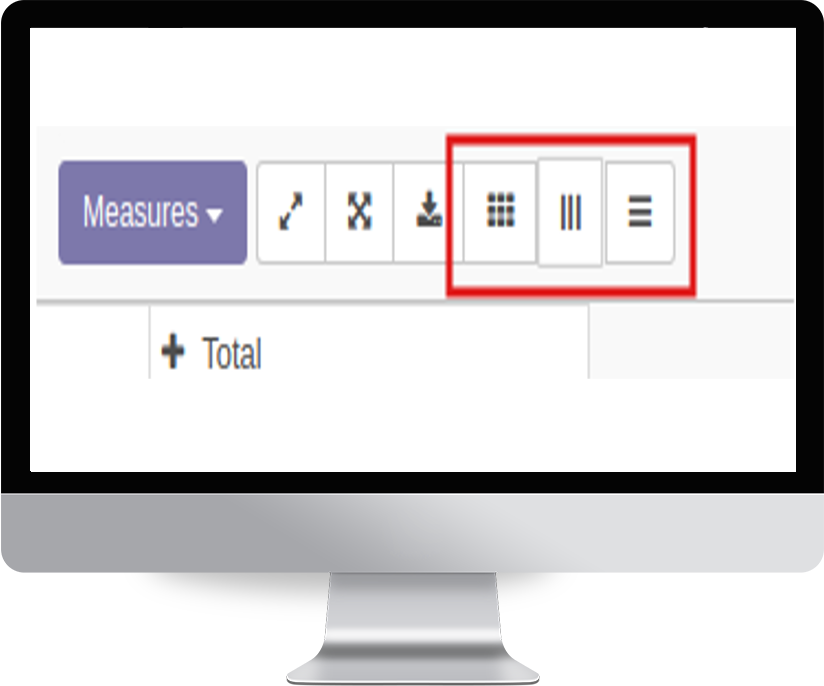
New buttons in the pivot view.
Clicking on these buttons will enable the corresponding heat map.
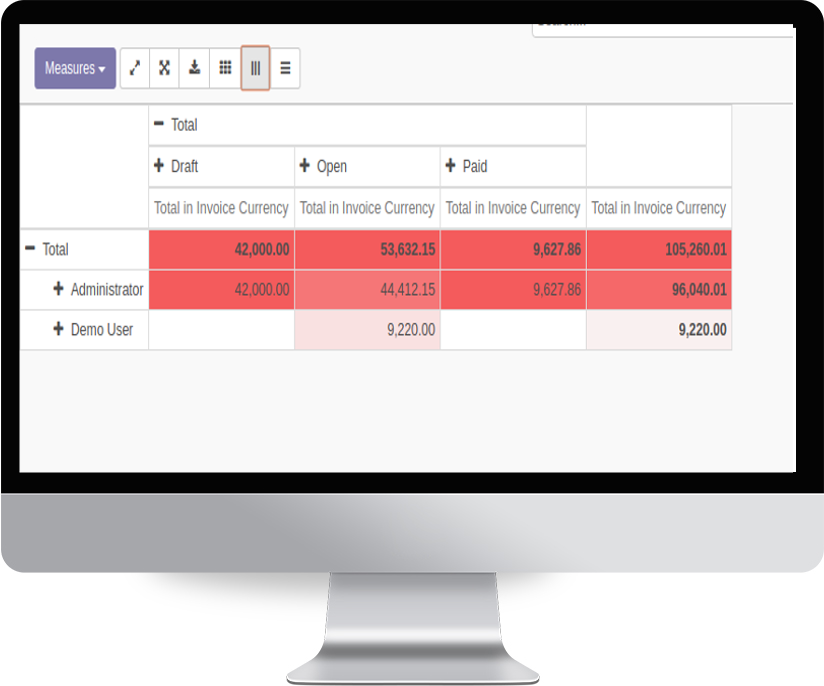
Heat Map Row
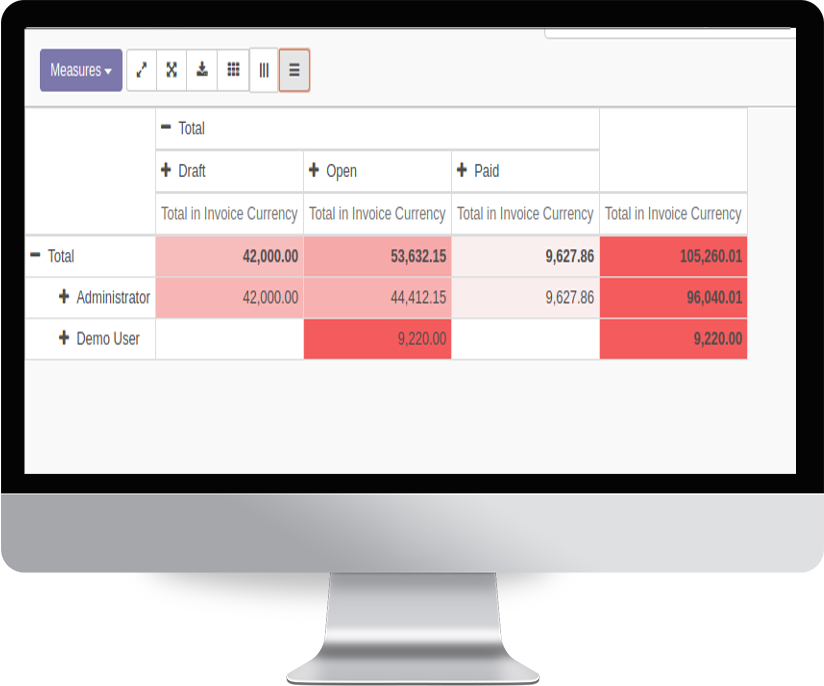
Heat Map Page
Our Industries
Easily procure and sell your products.
Plan, track and schedule your operations.
Run your bar or restaurant methodical.
Easy configuring and convivial selling.
Mobile friendly, awe-inspiring product pages.
An all-inclusive hotel management application.
A Collaborative platform for educational management.
Keep track of services and invoice accordingly.