☀ This Module Helps to Analyse Project in Various Aspects.
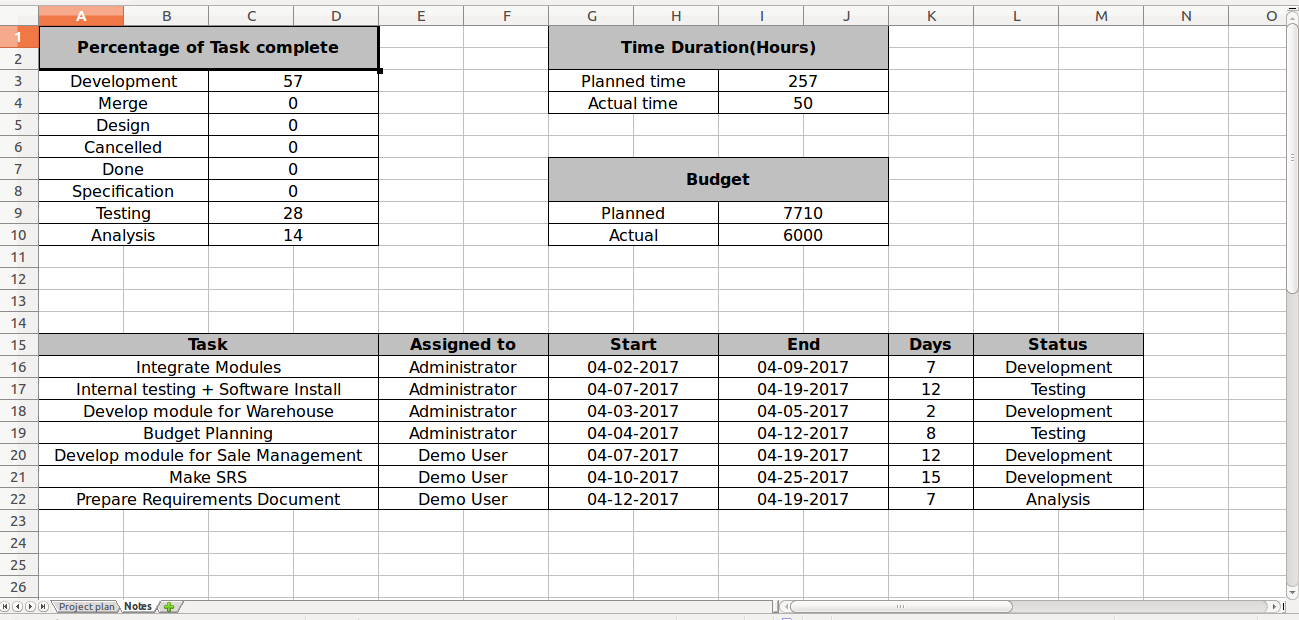
☀ Complete Project Status XLS Report with Budget Analysis.
☀ Tasks, Gantt chart XLS Analysis.
☀ Project Breakdown Charter Analysis.
☀ Complete Project Status XLS Report with Budget Analysis.
☀ Tasks, Gantt chart XLS Analysis.
☀ Project Breakdown Charter Analysis.